
Grant Distribution Report
This report presents an overview of grant allocation and participation patterns across countries, career stages, inclusiveness criteria, and time. Drawing on multiple datasets, it examines who participates, where funding is allocated, how inclusiveness is operationalised, and how the programme has evolved over successive grant periods. The analysis focuses on proportional distributions and counts, rather than absolute monetary values.
1. Grant Distribution Across Countries
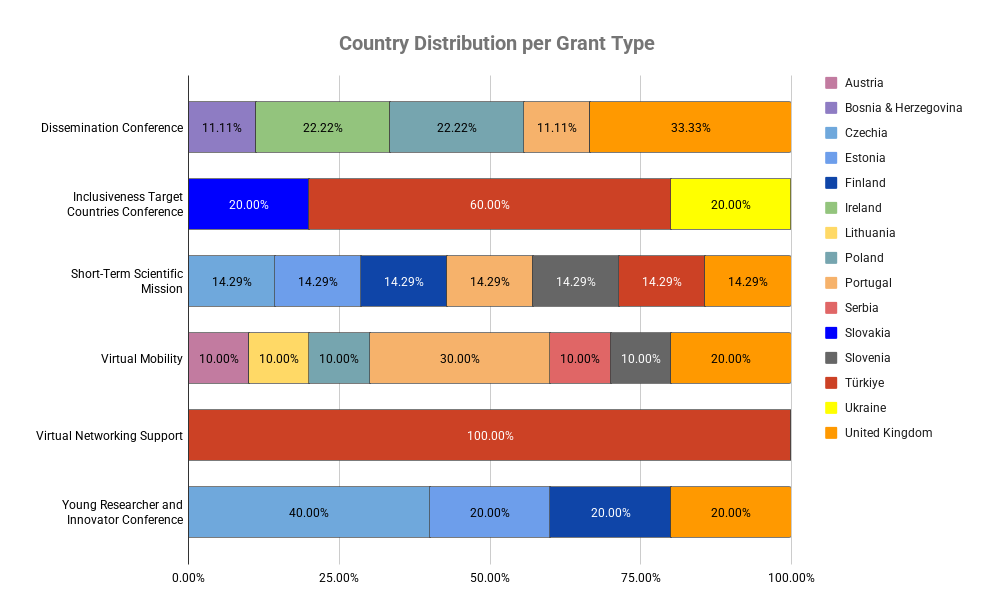
The country-level analysis examines how different grant types are distributed geographically, based on percentage shares per grant category. These percentages reflect relative participation within each grant type, not total funding volumes.
Concentration in Specific Grant Types
Several grant types show a high degree of concentration in a small number of countries:
Inclusiveness Target Countries Conference grants were also highly concentrated, with Türkiye receiving 60%, and Slovakia and Ukraine each receiving 20%.
Dissemination Conference grants were more distributed, though still led by the United Kingdom (33.33%), followed by Ireland and Poland (both 22.22%).
These patterns indicate that some grant instruments are highly targeted, either by design or through application dynamics.
Overall Country Participation
By summing each country’s shares across all grant types, we obtain an indicator of overall involvement in the programme.
Türkiye shows the highest cumulative share, reflecting both participation in multiple grant types and dominant shares in some categories.
The United Kingdom and Portugal follow, indicating consistent engagement across several funding instruments.
Austria, Lithuania, and Serbia make up the lowest tier of overall participation in grants.
It is important to note that this cumulative share reflects frequency and prominence, not total financial value.
More Balanced Grant Schemes
Not all grant types are highly concentrated:
Short-Term Scientific Missions are relatively evenly distributed, with Czechia, Estonia, Finland, Türkiye, Slovenia, and the United Kingdom each receiving comparable shares.
Virtual Mobility grants also show a mixed pattern, led by Portugal (30%) and the United Kingdom (20%), alongside several countries with smaller equal shares.
These schemes appear to support broader geographic participation.
2. Young Researcher Participation
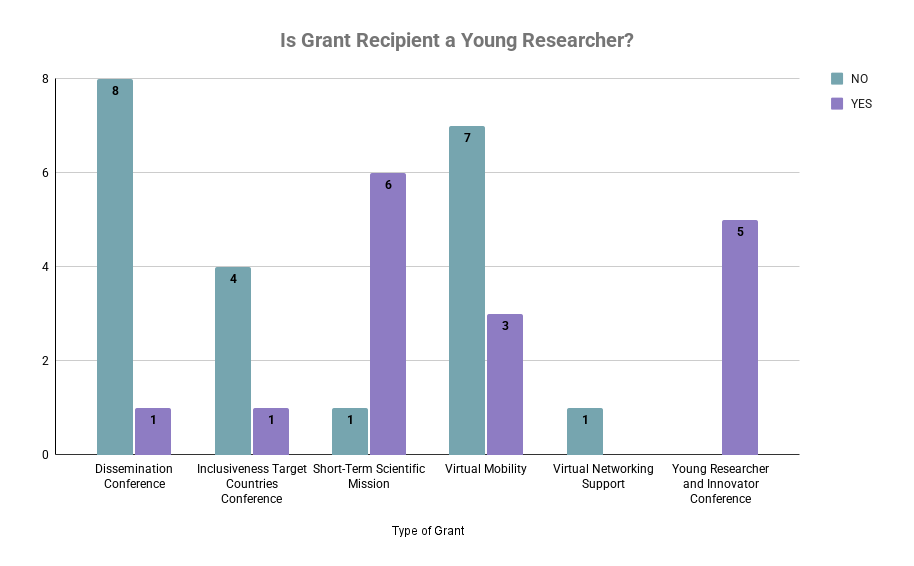
This section analyses participation by Young Researcher status, offering insight into the programme’s career-stage balance.
Key Findings
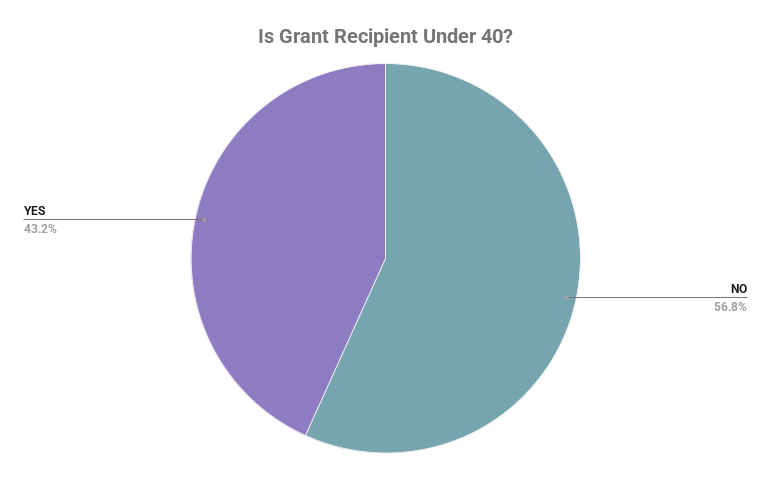
56.76% of participants are not classified as Young Researchers, indicating strong engagement from mid-career and senior researchers.
43.24% of participants are classified as Young Researchers, representing a substantial early-career presence.
Interpretation
While non–Young Researchers form a slight majority, the proportion of Young Researchers is notably high. This suggests that the programme is not dominated by senior scholars, but instead supports a mixed career-stage ecosystem. Such a balance creates favourable conditions for mentoring, skills transfer, and intergenerational collaboration.
3. Grant Allocation by Inclusiveness Target Country (ITC) Status
This analysis examines how grants are distributed between Inclusiveness Target Countries (ITC) and non-ITC countries, based on grant counts.
Key Findings
Two grant types are fully dedicated to ITC countries:
Inclusiveness Target Countries Conference: 100% of five grants awarded to ITC countries.
Virtual Networking Support: the single grant awarded went entirely to an ITC country.
These schemes function as explicitly redistributive instruments.
Predominant ITC Allocation Across Most Grant Types
Even where grants are open more broadly, ITC countries receive the majority of awards:
Virtual Mobility: 70.00% of grants awarded to ITC countries.
Short-Term Scientific Missions: 71.43% awarded to ITC countries.
Young Researcher and Innovator Conference: 60.00% awarded to ITC countries.
The Most Balanced Grant Type
The Dissemination Conference is the most evenly distributed scheme:
55.56% of grants awarded to non-ITC countries.
44.44% awarded to ITC countries.
This balance likely reflects the outward-facing nature of dissemination activities, where reach and visibility may outweigh inclusiveness criteria.
Overall, the data points to a systematic and multi-layered inclusiveness strategy. Some grant types are fully earmarked for ITC countries, while others strongly prioritise them without formal exclusion of non-ITC applicants. The coexistence of targeted and balanced schemes suggests a deliberate alignment between funding design and programme objectives.
4. Growth in Grants Awarded Over Time
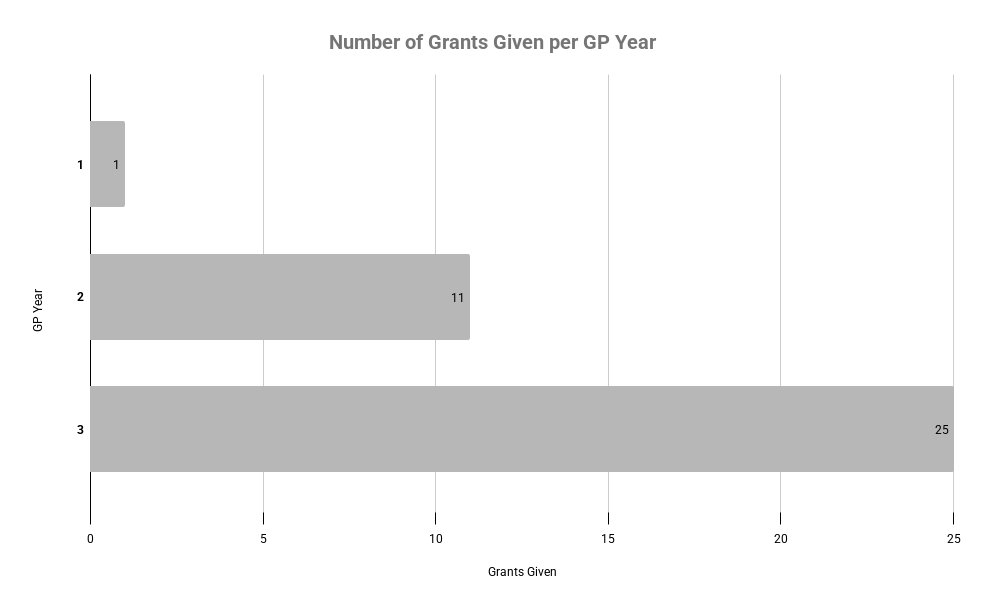
The final section examines how the number of grants awarded has evolved across three Grant Periods (GP Year 1–3).
Key Findings
GP Year 1: 1 grant awarded (2.70% of total).
GP Year 2: 11 grants awarded (29.73%).
GP Year 3: 25 grants awarded (67.57%), representing a twenty-five-fold increase compared to GP Year 1.
Across all periods, 37 grants were awarded in total, with more than two-thirds concentrated in the most recent period. The data shows a programme in rapid expansion, rather than incremental growth. Early periods appear exploratory, while GP Year 3 reflects consolidation, increased demand, and greater operational capacity. This growth aligns with the observed rise in participation, inclusiveness, and diversification of grant types.
A bar chart titled “Grants Given by Grant Period (GP Year 1–3)” can be included here to visually illustrate this trajectory.
Concluding Remarks
Taken together, these findings show a funding programme that has scaled quickly, prioritised inclusiveness, and maintained a strong balance across countries and career stages. Grant design combines targeted support for Inclusiveness Target Countries with more open and competitive schemes, while sustained growth over time suggests increasing visibility, trust, and engagement within the research community.
This multi-dimensional approach—spanning geography, career stage, and temporal development—indicates a mature and strategically aligned grant ecosystem.